Capital Bancorp (CBNK)·Q4 2025 Earnings Summary
Capital Bancorp Delivers Strong Q4 as EPS Doubles YoY, IFH Integration Complete
January 26, 2026 · by Fintool AI Agent
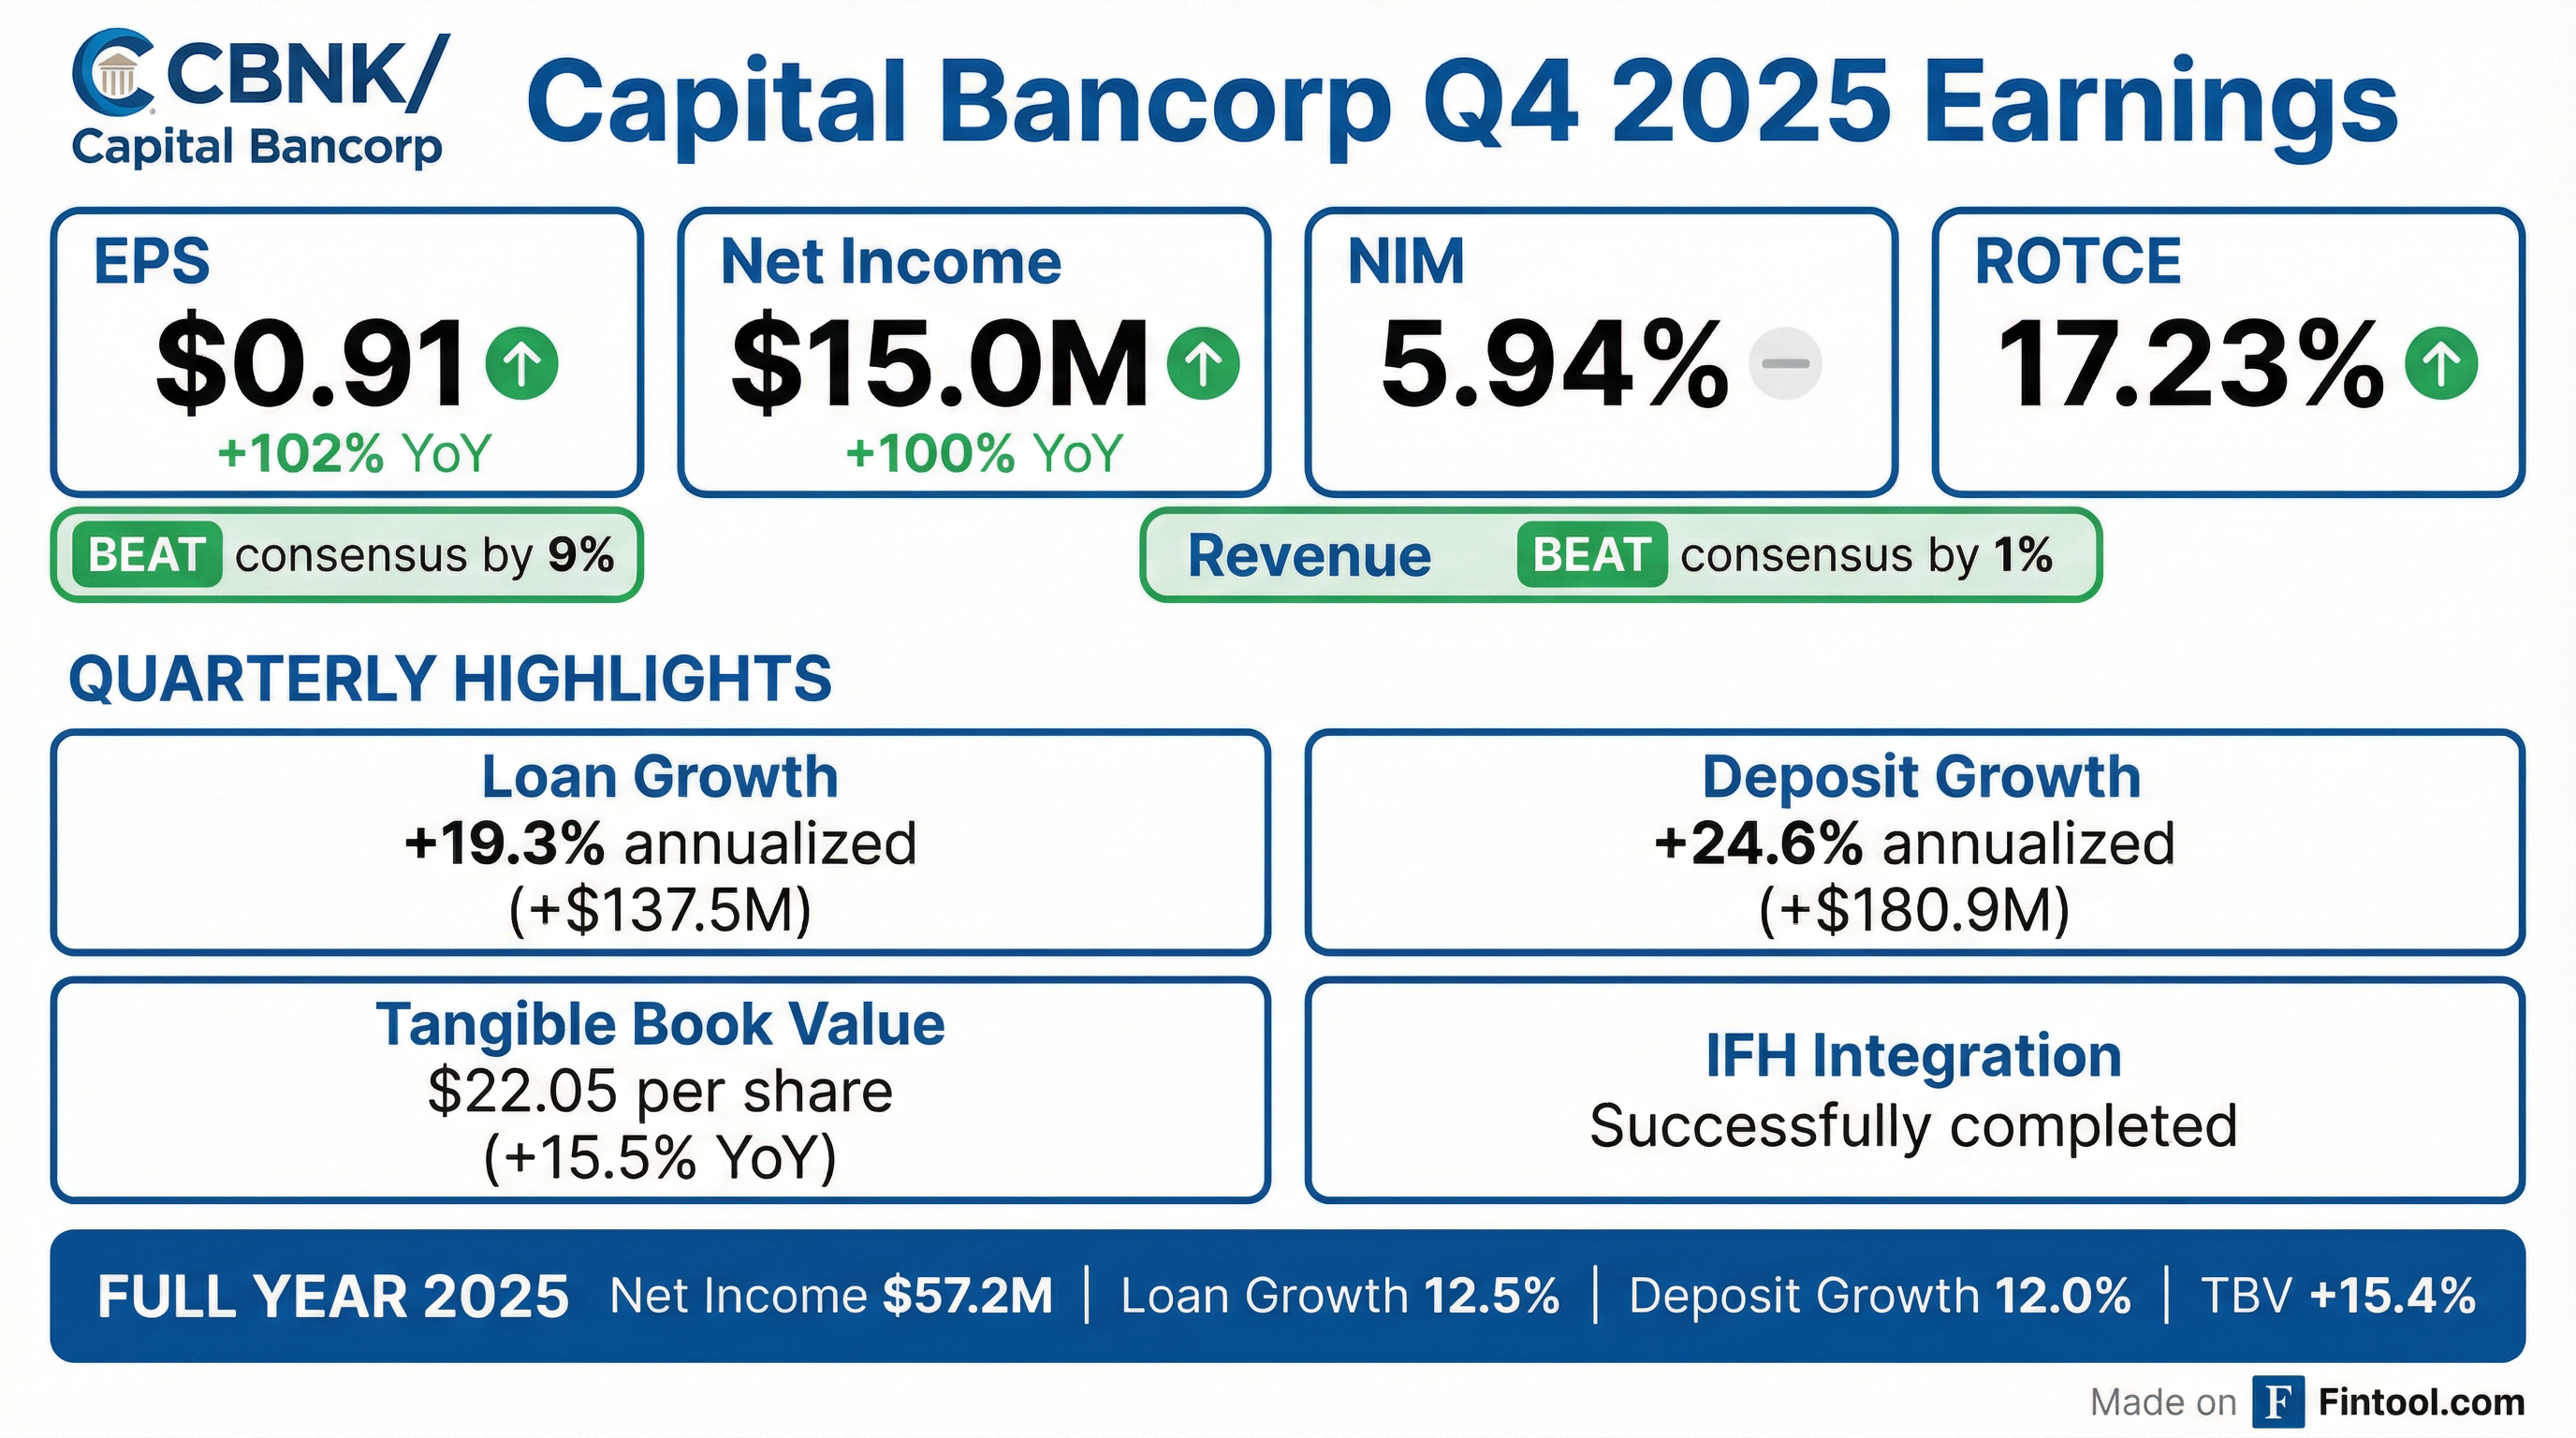
Capital Bancorp (NASDAQ: CBNK) reported Q4 2025 results that exceeded expectations on both the top and bottom line. Diluted EPS of $0.91 beat consensus by 9.6%, while revenue of $62.7M topped estimates by 1.0%. The quarter marked the completion of the IFH acquisition integration, setting the stage for normalized operations in 2026.
Did Capital Bancorp Beat Earnings?
Yes — CBNK beat on both EPS and revenue.
The EPS beat was driven by strong loan growth, stable margins, and continued momentum in the OpenSky secured credit card business, which now contributes 66% of net income.
Year-over-year performance was exceptional:
Note: Q4 2024 EPS was depressed by $2.6M non-recurring equity write-down and $3.2M IFH acquisition-related provision. Core EPS was $0.92 in Q4 2024 vs $0.91 in Q4 2025.
What Were the Key Operating Highlights?
The quarter featured robust balance sheet growth across both loans and deposits:
Loan growth of $137.5M was driven by:
- C&I loans: +$79.1M
- Residential real estate: +$25.7M
- Construction real estate: +$15.3M
- Lender finance: +$9.5M
- OpenSky credit cards: +$5.9M
How Did Margins Perform?
Net interest margin compressed 42 basis points sequentially but remained elevated at 5.94%:
*Q3 2025 cost of deposits benefited from a 63 bps impact from the call of brokered time deposits. Excluding this item, Q3 cost of deposits would have been 2.36%, consistent with Q4.
The elevated consolidated NIM reflects the high-yield OpenSky credit card portfolio, which carries yields significantly above traditional commercial bank lending.
What's Driving Profitability?
Capital Bancorp's unique business model includes four distinct segments. OpenSky, the secured credit card business, has become the dominant profit contributor:
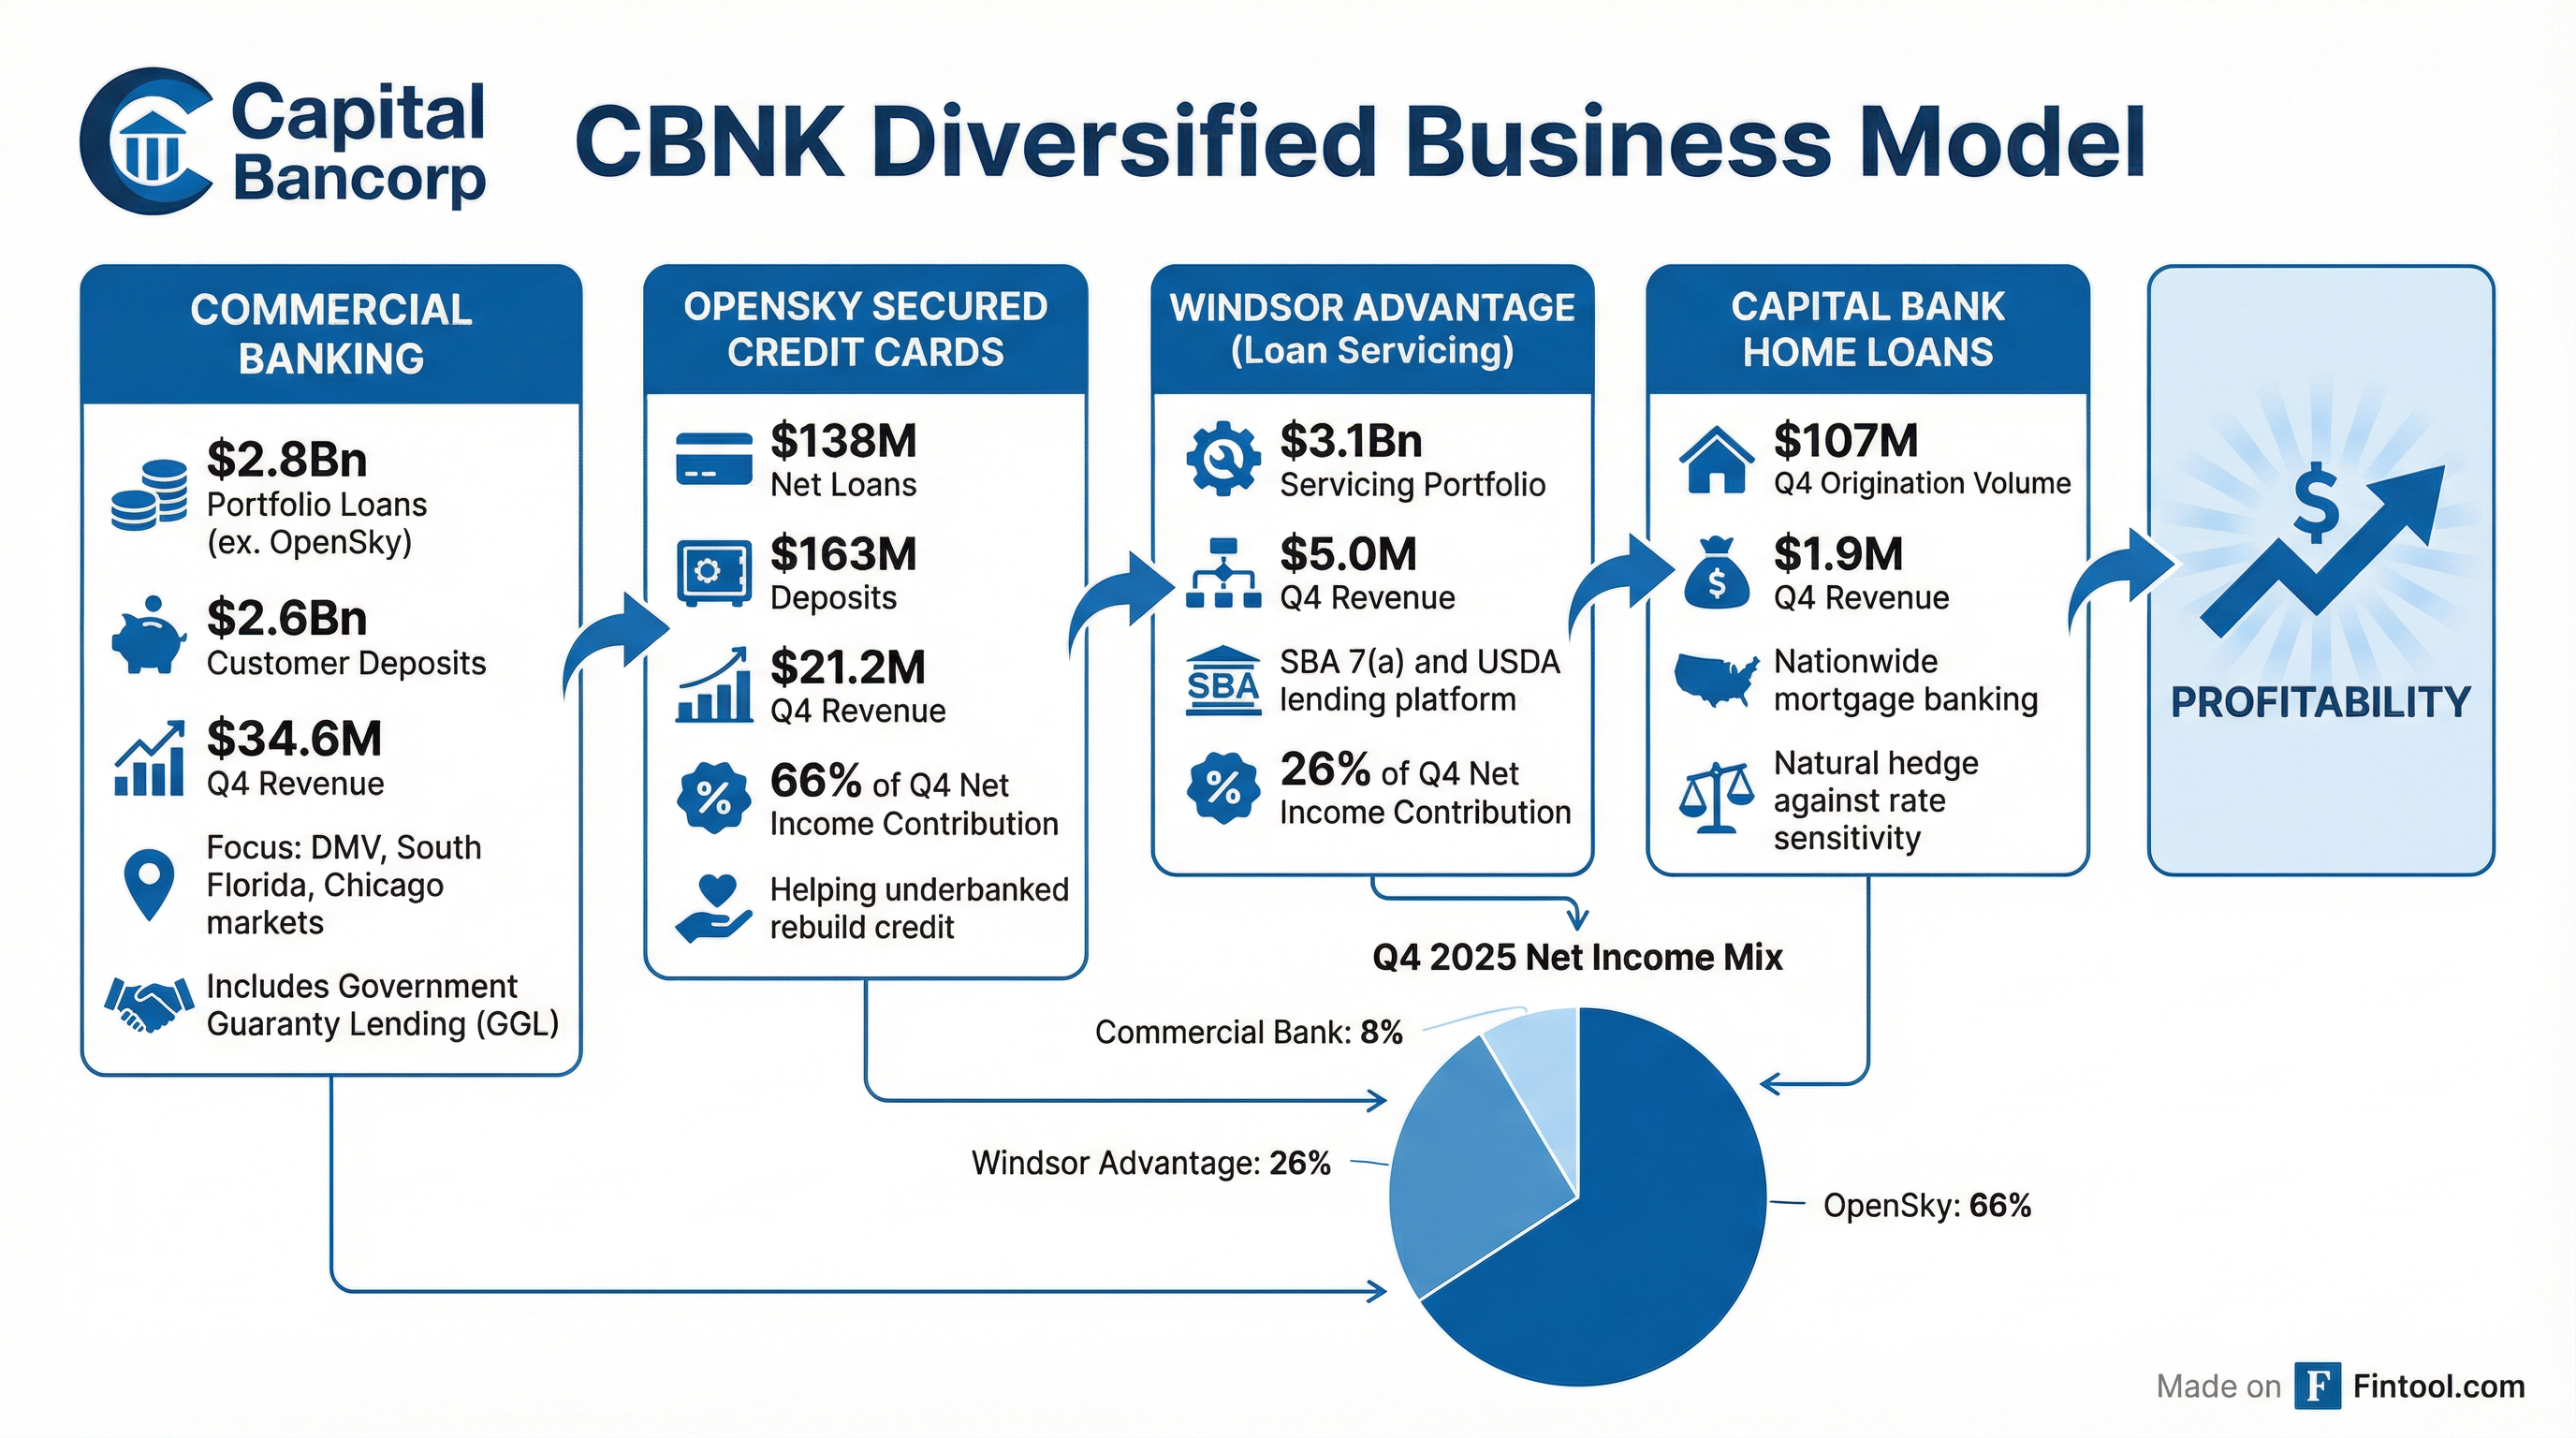
Q4 2025 Segment Contribution:
- OpenSky: 66% of net income — The secured credit card platform helps underbanked customers rebuild credit while generating high yields
- Windsor Advantage: 26% of net income — $3.1B loan servicing portfolio for SBA 7(a) and USDA loans
- Commercial Bank: 8% of net income — Core banking operations across DMV, South Florida, and Chicago markets
How Is Credit Quality Trending?
Credit metrics showed modest deterioration but remain manageable:
The YoY increase in NPAs reflects the legacy IFH portfolio integration. Net charge-offs remain well controlled at 32 bps annualized, below the prior quarter and year-ago levels.
How Strong Is the Capital Position?
Capital ratios remain robust with significant buffers above regulatory minimums:
The slight decline in capital ratios reflects the strong loan growth during the quarter, which increased risk-weighted assets.
How Did the Stock React?
The stock traded essentially flat on earnings day, closing at $29.40 (+0.1%).
The muted reaction suggests the beat was largely in line with expectations following strong Q3 results. The stock has pulled back from its 52-week high of $36.40 reached in late 2025.
What Changed From Last Quarter?
Positives:
- ✅ IFH integration now complete — operational synergies fully captured
- ✅ Loan growth accelerated to 19.3% annualized from 12.5% FY average
- ✅ Deposit growth outpaced loan growth, improving funding position
- ✅ Net charge-offs declined to 0.32% from 0.35%
Watch Items:
- ⚠️ NIM compressed 42 bps QoQ (though still elevated at 5.94%)
- ⚠️ NPAs/Assets ticked up to 1.62% from 1.54%
- ⚠️ Capital ratios declined modestly on strong loan growth
Full Year 2025 Summary
The company successfully completed the IFH acquisition integration during 2025, adding scale in the commercial banking and government guarantee lending verticals.
Forward Catalysts
Near-term drivers to watch:
- Rate environment: The elevated NIM benefits from OpenSky's high-yield credit card book, but rate cuts could pressure commercial bank NIM
- OpenSky expansion: Management is building capabilities to cross-sell products and extend unsecured credit to graduating customers
- Windsor Advantage growth: Positioned to benefit from higher industry-wide SBA volumes
- Credit normalization: Watch NPL trends as legacy IFH portfolio seasons
Key Takeaways
Capital Bancorp delivered a solid Q4 that beat expectations and capped off a successful integration year. The diversified business model—with OpenSky contributing two-thirds of profits—provides differentiated earnings streams compared to traditional community banks. At 1.33x tangible book value, the stock trades below the regional bank median, potentially reflecting smaller market cap and unique business mix.
View Capital Bancorp company page | Q4 2025 Earnings Transcript | Q3 2025 Earnings